
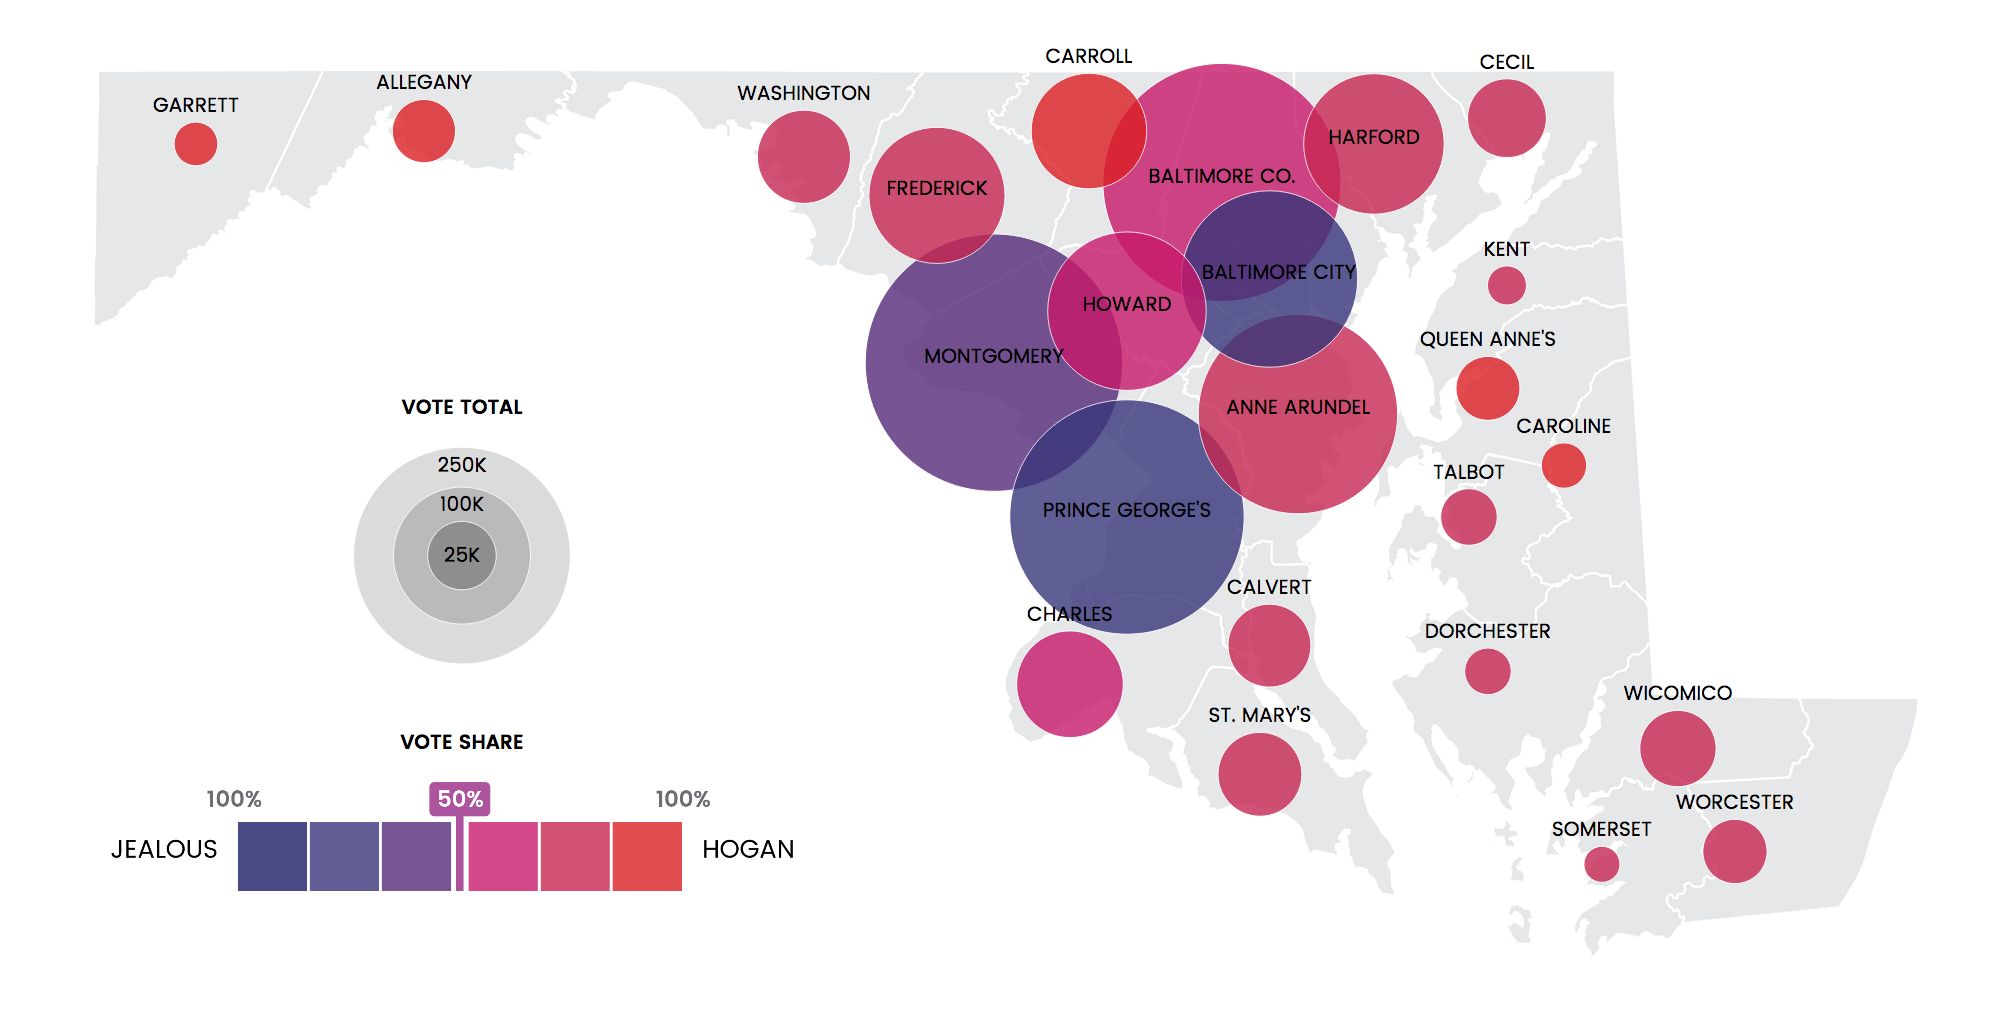
How did Maryland vote in the governor's race?
Map, web app
I built an election site that displays live-updating election results from the Maryland governor's race. The map shows how each county voted in proportion to the number of votes cast there.
Tools: JavaScript, jQuery, D3.js, AJAX, HTML/CSS, Illustrator, QGIS

Books and Their Movies
Website, graphics, data, story
When a book becomes a movie, how are book sales affected? I analyzed the New York Times Best Sellers List (via the NYT Books API) to find out.
Tools: D3.js, jQuery, Python/pandas, HTML/CSS, Photoshop, Excel
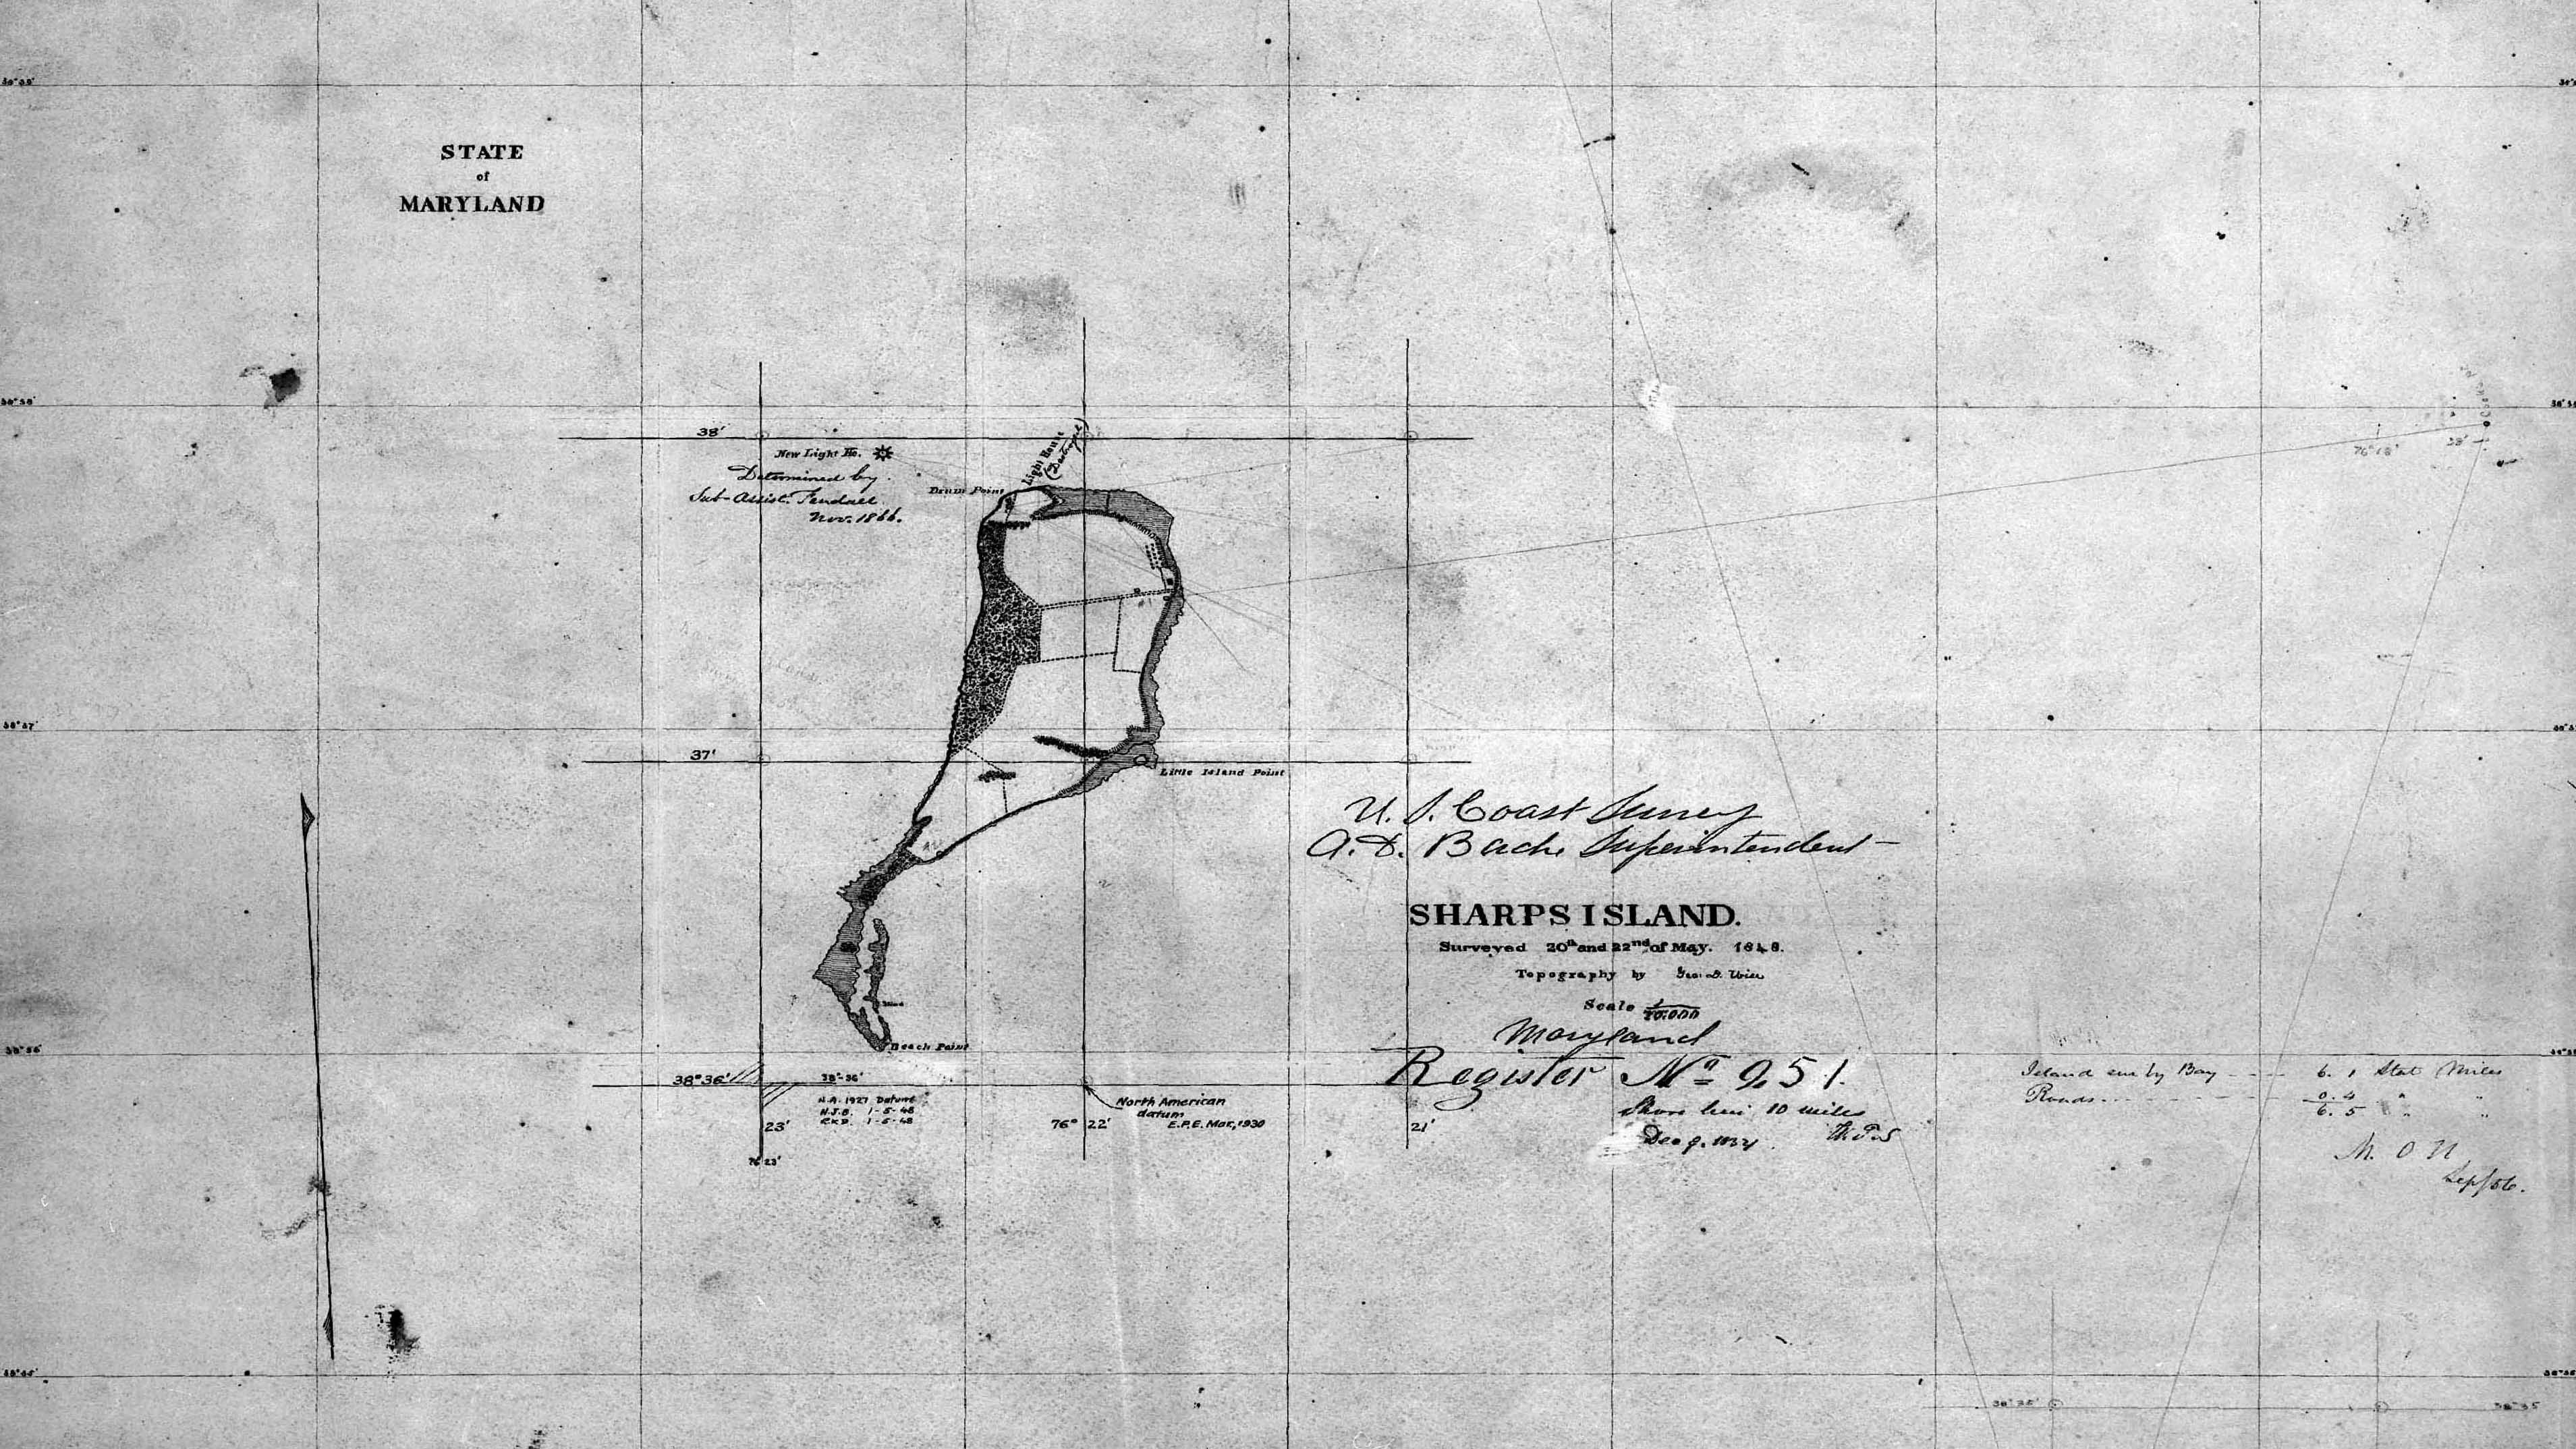
The Lost Islands
Website, maps, story
Custom maps showing the hundreds of islands that have sunk into the Chesapeake Bay — and the ones we'll lose in the future.
Tools: QGIS, jQuery, Illustrator, HTML/CSS

Jealous aims to become Maryland’s 1st African-American governor
Graphic, illustration
Maryland gubernatorial candidate Ben Jealous sat down by a Capital News Service reporter, and I built a graphic for the story showing how he's polled throughout the campaign. I designed the photo illustration that served as the lead art, too.
Tools: D3.js, Photoshop
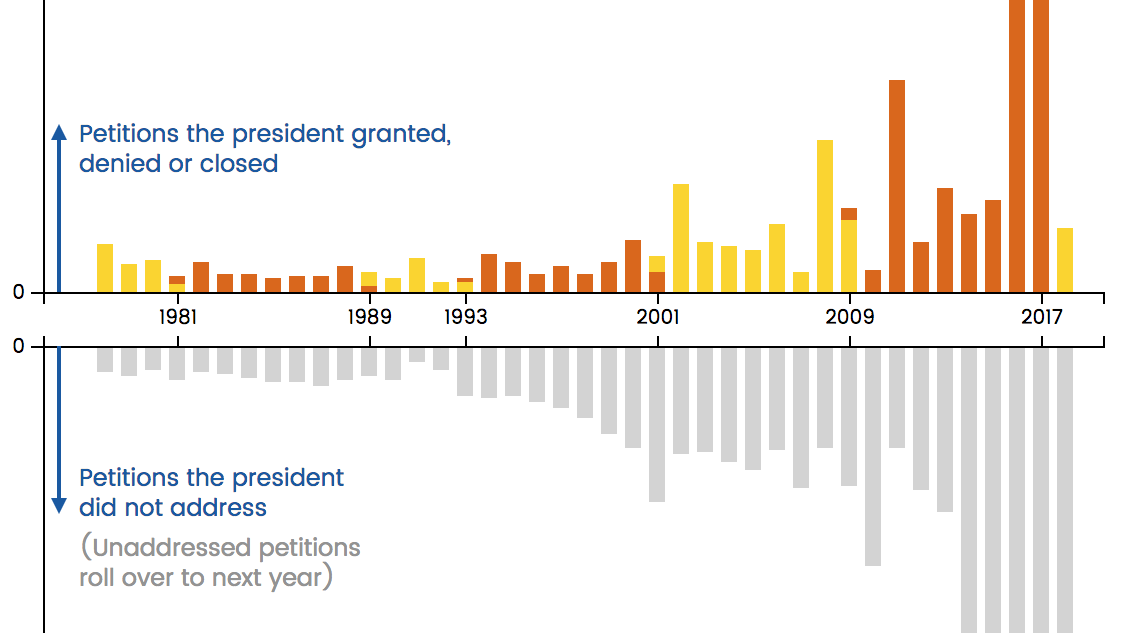
Presidential Pardons
Graphics, data, story
Trump isn't using his pardoning power like past presidents, and we have the data to prove it.
Tools: D3.js, Python/pandas
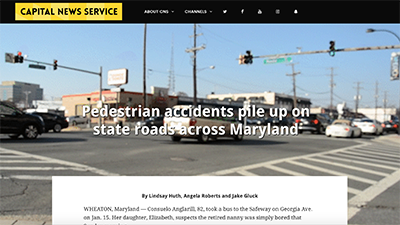
Pedestrian Casualties
Website, graphics, data, story
I worked on a small team that used Maryland accident records to analyze pedestrian fatalities on state roads. I presented the findings using words and graphics on a custom-built webpage. The story was a finalist for a student IRE Award and an SPJ D.C. Pro Dateline Award, and it served as the basis for a Washington Post op-ed.
Tools: R, HTML/CSS, Illustrator
Kansas City Car Auction
Graphics, data, story
Interested buyers flood the Kansas City Tow Lot each month for their chance to bid on the hundreds of vehicles that have come into the city's custody. I analyzed the 5,200 cars auctioned off in the last year and built interactives.
Tools: D3.js, HTML/CSS, Excel
Trading Away Justice
Website, data, graphics
What happens when defendants plead guilty to crimes they didn't commit? I performed all data analysis and designed and built the site and graphics and presented this project at the 2018 IRE Conference.
Tools: SQL, HTML/CSS, Bootstrap, Illustrator
Reforming the Force
Website, interactives, data, story
I worked on a team investigating the Baltimore police's efforts to reform corrupt practices. I reported a data-driven story using traffic stop records requested from the state and then designed and built the site and interactives for the series.
Tools: R, JavaScript, HTML/CSS
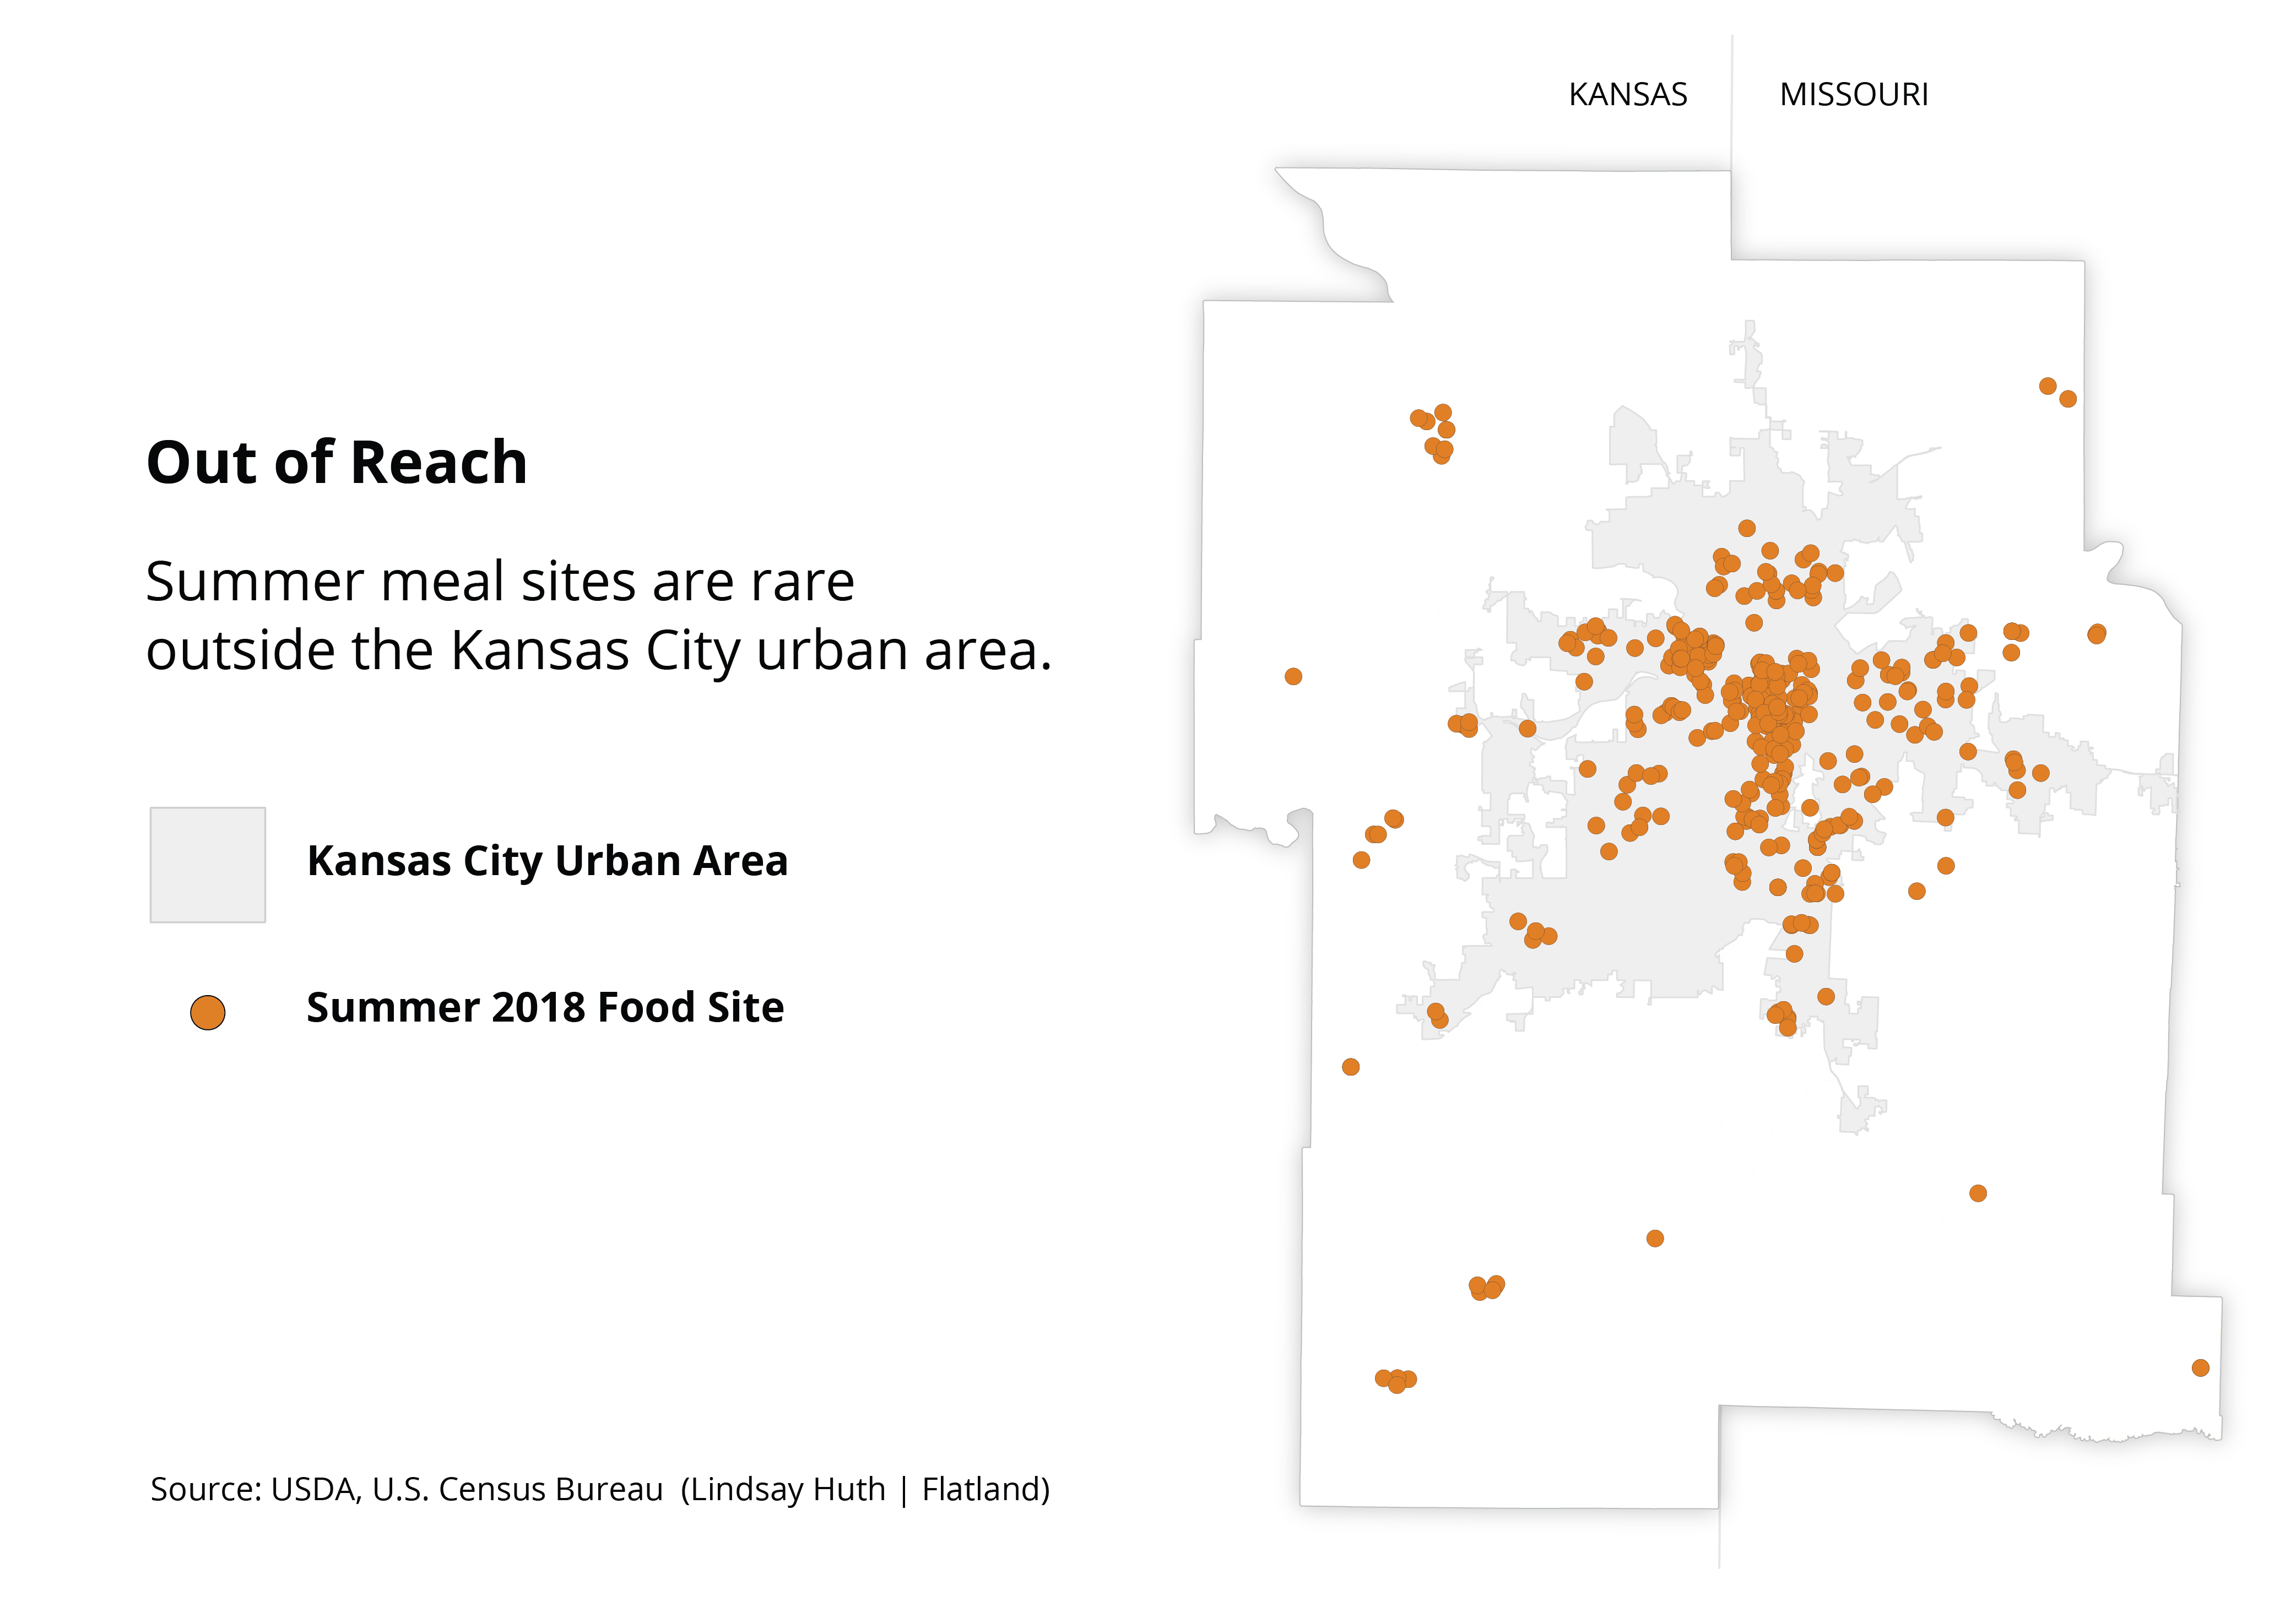
Rural and Hungry
Data, maps, story, photos
The government runs summer meal sites to feed kids who get free or reduced-price lunch during school. But when I mapped and analyzed the locations of those sites, I found that they're out of reach for many rural kids.
Tools: QGIS, Illustrator, Python